Mastering Business Process Visualization with the Hexagon Infographic Arrow
Bringing structure to a complex workflow, a strategic plan, or a multi-step methodology can feel overwhelming without the right visual tools. When bullet points and plain diagrams fall short, a thoughtfully designed visual aid can make all the difference. The Hexagon Infographic Arrow template is built for exactly that moment—turning abstract ideas into a clean, directional, and easy-to-follow narrative. It helps you communicate business processes, project stages, or improvement frameworks in a way that audiences immediately understand and remember.
Whether you are crafting a slide presentation for stakeholders, mapping a continuous improvement cycle, or designing a methodology diagram, this hexagon-based arrow design gives you a head start. Its five-point step layout guides the viewer’s eye from start to finish, while the hexagonal shapes reinforce structure, stability, and logical flow. Let’s explore how this resource meets real communication challenges and how you can apply it to your own work.
What Exactly Is a Hexagon Infographic Arrow Template?
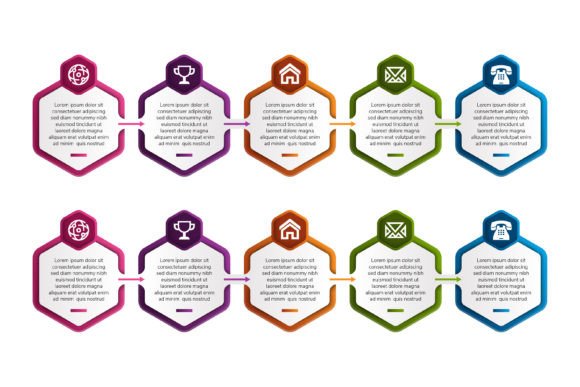
At its core, a Hexagon Infographic Arrow is a vector-based diagram template that uses interconnected hexagonal boxes arranged along an arrow-shaped path. Each hexagon acts as a container for a step, milestone, goal, or data point. The arrow direction emphasizes linear or cyclical progression, making it ideal for illustrating processes with 5 distinct stages. This is not just a static image; it is a fully editable collection of professional graphics. You get high-resolution files at 300dpi—perfect for both digital presentations and crisp print materials—and every element, from text and colors to shapes and sizes, remains completely scalable and customizable.
Because the template is organized in popular formats like AI, EPS, SVG, and JPG, you can open it in software you already use. The EPS and AI files give you full control over every vector layer, while the JPG offers a quick, ready-to-insert option. This flexibility means you save hours of design time while maintaining brand consistency and clarity.
Understanding the Visual Structure
The 5-point step design is more than a pretty arrangement. Each hexagon box sits along a directional arrow, suggesting forward movement. The hexagonal shape itself is often associated with efficiency, innovation, and interconnection—qualities you want to project when explaining a business process or framework. Whether you label them Inputs, Process Stages, Outputs, Goals, or Options, the design naturally organizes information into digestible segments. The continuity implied by the arrow helps reinforce a seamless workflow, which is especially useful for continuous improvement models or sigma methodologies.
The Real-World Challenges You Face When Explaining Processes
Communicating a business process isn't just about listing steps. Many professionals struggle with slide decks that look cluttered, documents where the logic gets lost, or hand-drawn sketches that fail to impress. Here are a few common situations that call for a better visual approach:
- Audience confusion: When steps or dependencies aren't visually distinct, viewers misinterpret the sequence.
- Lack of engagement: Dense paragraphs and generic SmartArt often fail to hold attention during a presentation.
- Time constraints: Manually building a professional-looking diagram from scratch is time-consuming, especially when you have to update it frequently.
- Design inconsistency: Using mismatched graphics across a slide deck dilutes your message and looks unprofessional.
- Scaling issues: A low-resolution image becomes pixelated on a large screen or in print, undermining credibility.
These challenges can turn a simple status update or proposal into a frustrating experience. A ready-made, editable template directly addresses these pain points by giving you a solid foundation that’s already visually balanced, high-resolution, and logically structured.
How a Hexagon Infographic Arrow Template Solves These Problems
The Hexagon Infographic Arrow transforms the way you share information. Instead of explaining a five-stage project plan with words alone, you can map it onto a diagram where each stage occupies its own hexagon. The arrow direction intuitively signals progression from one step to the next, while the shape design adds a modern, polished look.
Create Clear Step-by-Step Guides
Standard operating procedures, onboarding checklists, or client implementation plans often contain exactly five key phases. Use the template to name each hexagon with a phase title, and add a brief description below. The result is a one-page visual guide that teams can reference and that leadership can quickly digest. The consistent hexagon shape prevents cognitive overload, making the process feel manageable.
Map Workflows and Methodologies
Business methodologies like DMAIC (Define, Measure, Analyze, Improve, Control) or the 5S framework fit naturally into a five-point hexagon arrow layout. Each hexagon can contain the methodology stage name, key activities, and inputs/outputs. Because the template is fully editable, you can tweak the number of points if needed, or adapt the colors to match your training materials. This visual mapping reduces the learning curve for new team members and reinforces the systematic nature of your approach.
Enhance Slide Presentations Instantly
Presentations are where this design truly shines. Use the Hexagon Infographic Arrow as the visual anchor of a slide, then build your talking points around it. Audiences follow the left-to-right or top-to-bottom flow without effort. When you need to highlight a specific stage, you can change its hexagon color or enlarge it slightly for emphasis—all without leaving the vector environment. The high 300dpi resolution guarantees that even projected on a large screen, lines stay crisp and text remains readable.
Practical Applications Across Different Roles
One of the greatest strengths of this hexagon arrow infographic is its adaptability. Different users approach the same template with unique goals, yet all benefit from its logical structure.
Project managers often use the diagram to illustrate a project timeline with five major milestones, from kickoff to closure. They replace generic milestone icons with hexagonal stages that contain date ranges, owner names, and status indicators. The arrow direction reinforces the forward movement of the project, and stakeholders appreciate the one-glance progress overview.
Marketing teams leverage the template to outline a campaign strategy. Each hexagon can represent a phase: Research, Planning, Creative, Execution, and Analysis. By placing the diagram in a proposal deck, they visually demonstrate a clear, methodical approach to clients or internal leadership. Editable text and shapes mean they can quickly swap out campaign specifics without redesigning the whole graphic.
Business consultants and coaches use the Hexagon Infographic Arrow to communicate improvement frameworks, goal-setting models, or operational playbooks. The hexagonal shape suggests interconnected ideas, not isolated steps, which aligns with holistic business thinking. The template becomes a thinking tool, not just a pretty slide.
Educators and trainers can break down complex theories into five digestible chunks. When explaining a strategic management model or a continuous improvement cycle, the visual cue of an arrow reduces ambiguity and helps learners retain information more effectively.
Key Considerations When Using Hexagon Infographic Arrow Designs
To get the most value from your template, keep a few practical guidelines in mind. First, maintain a clear hierarchy of information. The hexagon itself is excellent for the main step title, but additional details like metrics or descriptions can go in a companion text box or inside the shape in a smaller font. Don’t overcrowd a single hexagon; use the editable nature of the file to adjust shape sizes if needed.
Second, develop a consistent color palette. Since the template is editable, you can apply your brand colors to all shapes and arrows. This not only looks professional but also aids comprehension—consistent coloring signals related elements. For example, use a distinct hue for the current stage and a muted tone for future or completed steps.
Third, adapt the layout to your story. Although the default design targets a 5-step process, you may occasionally need four or six steps. Because it’s a well-organized vector file, you can easily duplicate or remove a hexagon, and the arrow path can be stretched or angled accordingly. This level of control means you’re never forcing your content into an ill-fitting template.
Finally, leverage the high resolution for various media. The 300dpi setup means you can export a single slide as a printable PDF, drop the SVG into a website, or use the JPG in a social media post without worrying about quality loss. Professional presentation demands professional-grade assets.
Where to Find a Reliable Hexagon Infographic Arrow Resource
When you invest in a template, you want confidence in its quality and flexibility. The vector-based Hexagon Infographic Arrow collection described here is built with that in mind. It arrives as a direct download including AI, EPS, JPG, and SVG files, so you are covered for vector editing, quick-place imagery, and web use. All graphics are 100% vector, meaning you can scale them to any size without losing sharpness.
Key features that align with practical needs include:
- Editable text, shapes, and colors – modify labels, swap icons, or recolor elements to suit your brand.
- Well-organized layers – easy navigation even for those with moderate design software skills.
- High resolution 300dpi – print-ready for handouts, reports, or large-format displays.
- Multi-purpose design – works for timelines, option analysis, process mapping, and methodology diagrams.
This kind of resource isn’t just a one-time file; it becomes a reusable asset in your design kit. Once you master the editing basics, you can repurpose the hexagon arrow concept for client proposals, internal training decks, and even infographic banners.
Getting the Most Out of Your Infographic Diagrams
To truly enhance communication, think of the diagram as a visual anchor, not the entire message. Pair the hexagon infographic with concise bullet points on the same slide or document, and use the arrow flow to guide a story. When presenting, walk your audience through each hexagon and elaborate on the description. Because the template supports editable text, you can refine titles until they are succinct and memorable.
Always test readability from a distance. If the diagram will appear in a conference room projection, check that font sizes within hexagons remain legible. Adjust contrast as needed—dark text on light hexagons or light text on dark hexagons both work, but stay away from color combinations that strain the eyes.
Finally, reuse and iterate. A well-designed process diagram shouldn’t be abandoned after one presentation. With minimal edits, you can adapt it for quarterly business reviews, onboarding guides, or website explainer sections. That’s the efficiency gain of having an organized, editable vector template: one asset serves multiple communication needs.
Why a Hexagon Infographic Arrow Makes Your Message Stick
Visuals structured around a clear, recognizable shape like the hexagon do more than decorate a slide; they create a mental model. Viewers remember the sequence because they can picture the arrow’s direction and the distinct shape of each step. When you combine that with professional design and complete editability, you get a communication tool that works as hard as you do. Rather than wrestling with basic drawing tools, you can focus on your message while the Hexagon Infographic Arrow template handles the visual grammar.
Whether you are outlining a project’s five stages, detailing inputs and outputs for an improvement initiative, or building a framework for strategic goals, this type of diagram equips you to present with clarity, confidence, and style.